AIHack 2021
Presentation
The Team
The indecisive twigs are:
The Challenge (or Corn: What is it good for?)
Overpopulation and climate change are the challenges of our time. Their combination inevitably leads to food shortages, as surging demand and unstable supply drive fierce competition for the very thing we need to survive. While this scenario (obviously) hasn't happened yet, it is not at all unlikely to occur within the next few decades. As part of the AI Hack hosted by the Imperial College Data Science Society, we worked on an approach to use AI to make predictions that help inform agricultural decisions of farmers, companies and governments.

The Data
We were provided with a data set containing satellite temperature and biomass (Enhanced Vegetation Index) data across the state of Illinois from 2001 to 2019. This high resolution data in combination with the yield for each county and year was used to make predictions about the expected yield under different conditions, an approach that could readily be extended.
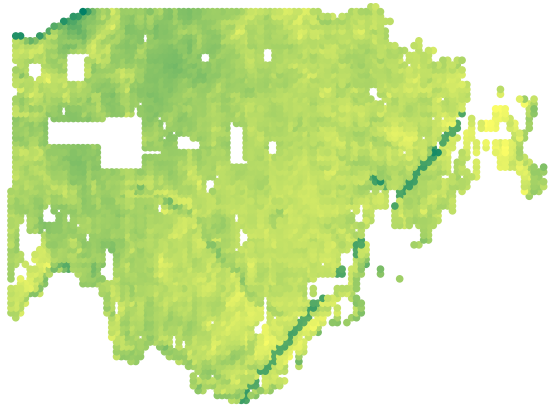
Taking a first look at the data, the EVI and Temperature can be plotted across the state of Illinois:
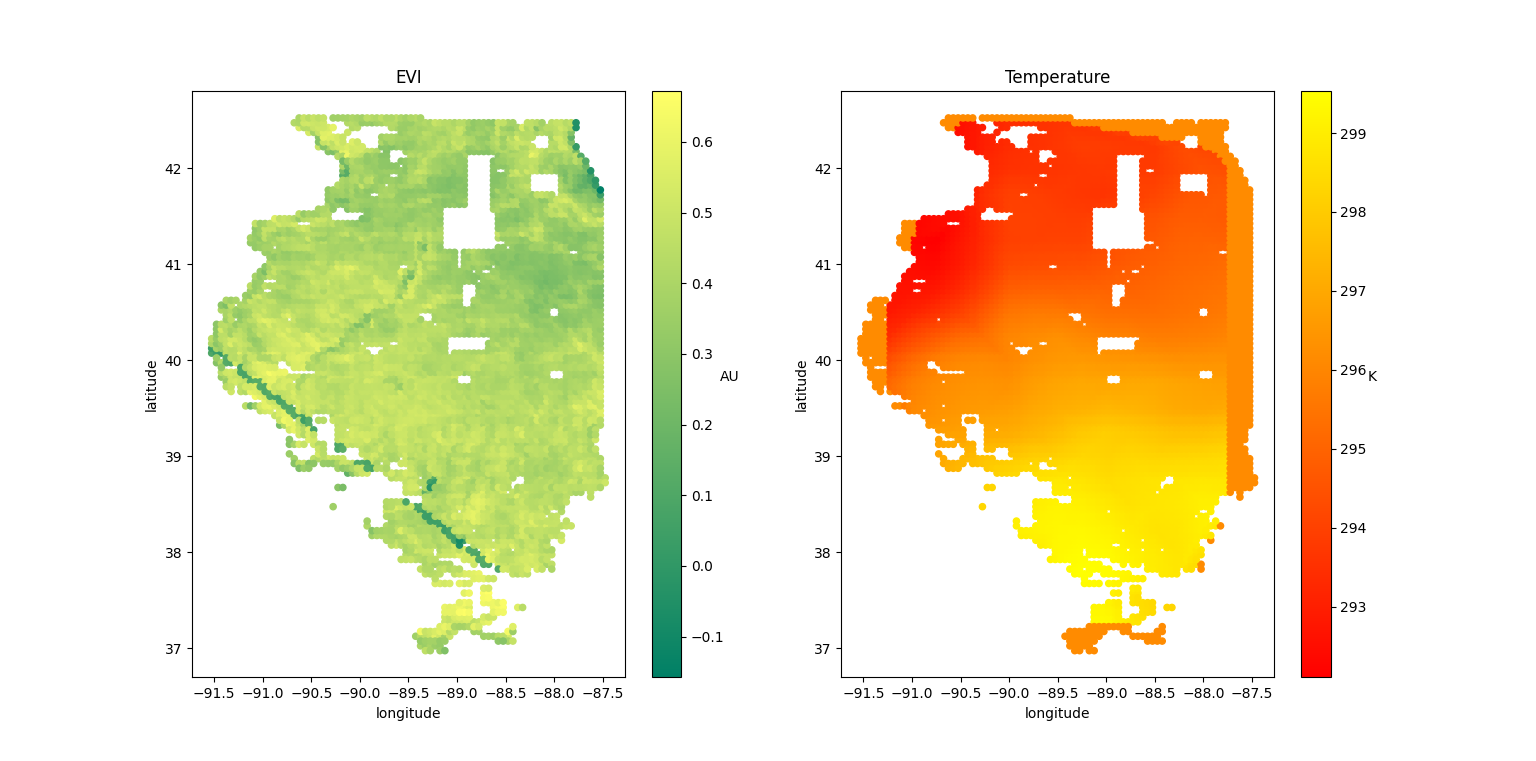
The issue here was that the temperature and EVI data came from different sources and were actually neither aligned in space nor time. Therefore, we had to linearly interpolate through space and time to align the data. We then grouped the data by year and county to align it with the yield data from the agricultural census. Finally, we removed all events where the yield, EVI or Temperature data were incomplete.


Finally we normalized the data (subtracted mean and divided by std) while keeping training and test set separate.
This left us with:
- 1370 events (each constituting a county and particular year)
- Varying numbers of EVI and Temperature readings per event
- The average yield in each county per year
This formally constitutes a Multiple Instance Learning (MIL) problem, which is weakly supervised (as we have different sets of input data and only one label to predict).
The Goal
Our goal was to now use the Temperature and EVI data and use it to make meaningful predictions about the yield in each county. The idea behind this approach is to then look at neighbouring states in the corn belt and maybe even other locations, and make predictions about their productivity for future, or past unrecorded years. Overall, this could help understand the requirements for bountiful harvests and allow the agricultural industry to invest in the right locations, especially as temperatures shift and the climate becomes more unstable.
The Model
Upsampling: An Attempt
Our first attempt was designed to perform upsampling: We wanted to not only train a model to make predictions for the overall county yield, but actually extract the expected yields at each location for which we had Temperature and EVI data.
The plan was to use a CNN model to predict the partial yield at each location from the temperature and EVI time series data and then average them across each county.
However, while we did successfully develop a model, the different county sizes caused vastly different numbers of input features per event. In the Hackathlon, we tried to address this problem by using a custom, ragged tensor model, but this was ultimately unsucessful due to time limitations.
Time Series CNN: The final Model
While the upsampling did not work out as expected, we were able to reuse the Time series CNN proposal from that attempt. But instead of using MIL, we had to average temperature and EVI across the different locations within a county. To retain a notion of localised variance, we also took the standard deviation of the data across the different location.

We then used the spatially averaged time series data for EVI and temperature and used the following combined CNN and Dense network:
- Conv1d: 3 Filters with Kernel Size 10
- Flatten
- Dropout: 40%
- Dense: 16 nodes, activation: ReLU, regularizer: L2
- Dropout: 25%
- Dense: 16 nodes, activation: ReLU, regularizer: L2
- Dropout: 25%
- Dense: 8 nodes, activation: Linear, regularizer: L2
- Dense: 1 node
The Results
We trained this model using a training set of 900 events, a validation set of 100 events and a test set of 370 events.
Using an early-stopping mechanism, the model finished after only 80 epochs, with more training generally leading to overfitting due to the small number of events.


The result was a good improvement over the raw data distribution, with a mean absolute error (mae) of 0.4 standard deviations in yield.
Plotting the predictions vs labels, we can see a clear positive trend between the two and no distinguishable difference in training and test set performance:
")